
Most teams call an Elasticsearch consulting company at one of three moments. Search pages that used to load instantly now take two seconds at peak. The cluster keeps flipping to yellow or red, and nobody is sure why. Or, users say the results are “wrong”, yet no one can prove whether the last change made things better or worse.
Those three problems, slow queries, cluster health and relevance, are connected. So fixing one in isolation often breaks another. This guide explains how Elasticsearch actually executes a search, what goes wrong at each step, how a consulting engagement fixes it, and how to judge whether the fix worked.
Why teams hire an Elasticsearch consulting company
Elasticsearch is easy to start and hard to run well at scale. For example, the defaults that are fine for one index on a laptop are rarely right for hundreds of indices across many nodes. Also, the people who built the first version have often moved on, leaving a cluster that works but that nobody fully understands.
- Latency: p95 search time creeps up as data grows, especially on filters, aggregations and deep pagination.
- Stability: shards stay unassigned, nodes hit heap limits, or disks cross the watermark and indexing stops.
- Relevance: the best result sits on page two, synonyms misfire, and every tweak is judged by opinion.
- Upgrades: the cluster is several major versions behind, so security fixes and newer vector features are out of reach.
Our own view comes from delivery work listed on our search platform projects page. It includes a global job search platform on Elasticsearch serving more than 40 countries with over 50,000 active listings, alongside large Apache Solr and Azure AI Search builds.
How Elasticsearch consulting starts: how a query actually executes
Before changing anything, it helps to know where the time goes. Every search follows the same path, and each step has its own failure modes.
Input and routing
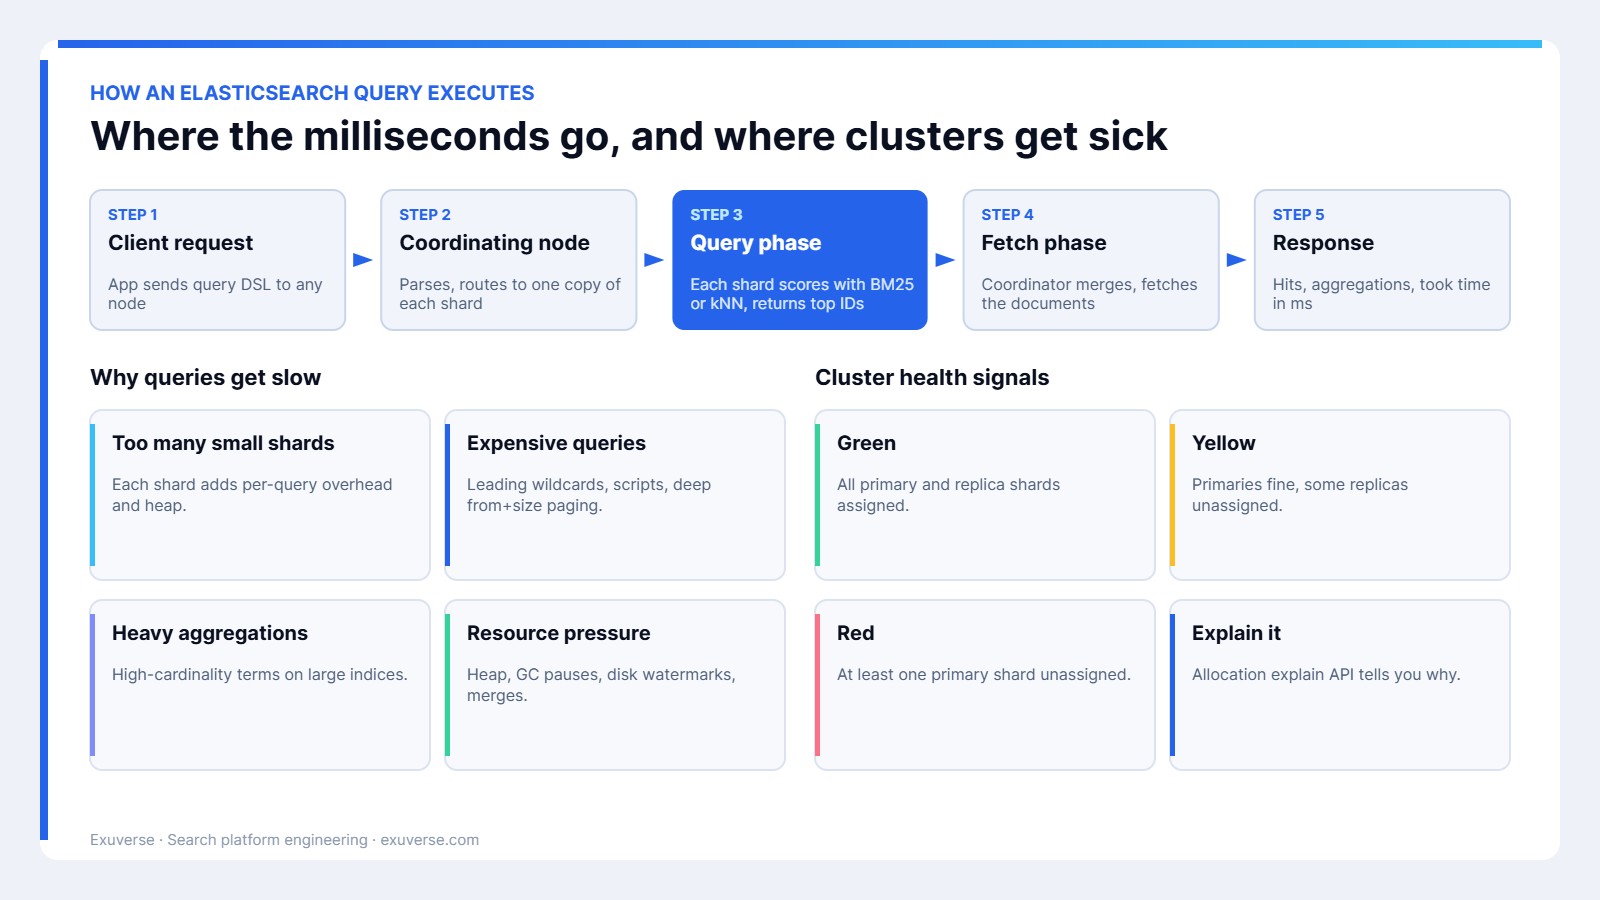
First, your application sends a query to any node, which acts as the coordinating node for that request. It parses the query DSL and sends it to one copy of every shard in the target indices. Consequently, a search across 300 shards means 300 small searches, even if most return nothing.
Query phase: scoring on each shard
Next, each shard runs the query locally and scores matching documents. Text relevance uses BM25 by default, while vector search uses approximate kNN. Each shard then returns only the IDs and scores of its top hits. This is where leading wildcards, regex, scripts and large terms aggregations burn CPU.
Fetch phase and response
Then the coordinator merges those lists, picks the global top results and fetches the full documents. Deep pagination hurts here, because asking for page 500 forces every shard to find thousands of candidates. For that reason, search_after with a point in time is the better tool for deep scrolling.
Monitoring and cluster health
Meanwhile, the cluster health API reports a simple colour. Green means all shards are assigned. Yellow means primaries are fine but some replicas are not, and red means at least one primary is missing, so some data is unsearchable. The allocation explain API then tells you exactly why a shard is stuck.
Fixing slow Elasticsearch queries
In practice, slow queries usually trace back to a handful of causes. The fix starts with evidence: search slow logs to catch the worst requests, then the Profile API to see which clause is expensive on which shard.
| Symptom | Likely cause | Typical fix |
|---|---|---|
| Latency grows with index count | Too many small shards | Consolidate to fewer, larger shards |
| Spikes on partial-word search | Leading wildcard or regex queries | Edge n-grams or a wildcard field type |
| Slow deep pages | Large from plus size values | search_after with point in time |
| Slow dashboards | High-cardinality terms aggregations | Pre-aggregate, or use composite aggregations |
| Random slow periods | GC pauses or heavy merges | Heap sizing, refresh interval, hardware tiers |
On sizing, Elastic’s own shard sizing guidance recommends aiming for shards between 10GB and 50GB and keeping each shard under 200 million documents. It also notes that searching a thousand 50MB shards is far more expensive than searching one 50GB shard. Therefore, oversharding is one of the most common problems we find.
Fixing Elasticsearch cluster health
Health problems tend to be slower-burning than latency, yet they cause the real outages. Here is what an Elasticsearch consulting review checks first:
- Allocation: unassigned shards, allocation filters left from old migrations, and replica counts that a small cluster cannot satisfy.
- Disk: watermarks, and whether index lifecycle management (ILM) rolls over and moves old data to cheaper tiers.
- Memory: heap set to no more than half of RAM and under the compressed-pointer limit, plus field data and mapping size.
- Mappings: dynamic mapping that has created thousands of fields, or text fields used where keyword was needed.
- Recovery: tested snapshots, because a replica is not a backup.
Similarly, an upgrade plan belongs in this phase. Rolling upgrades are routine when snapshots, deprecation logs and client versions are checked first; they are painful when they are not.
Fixing Elasticsearch relevance
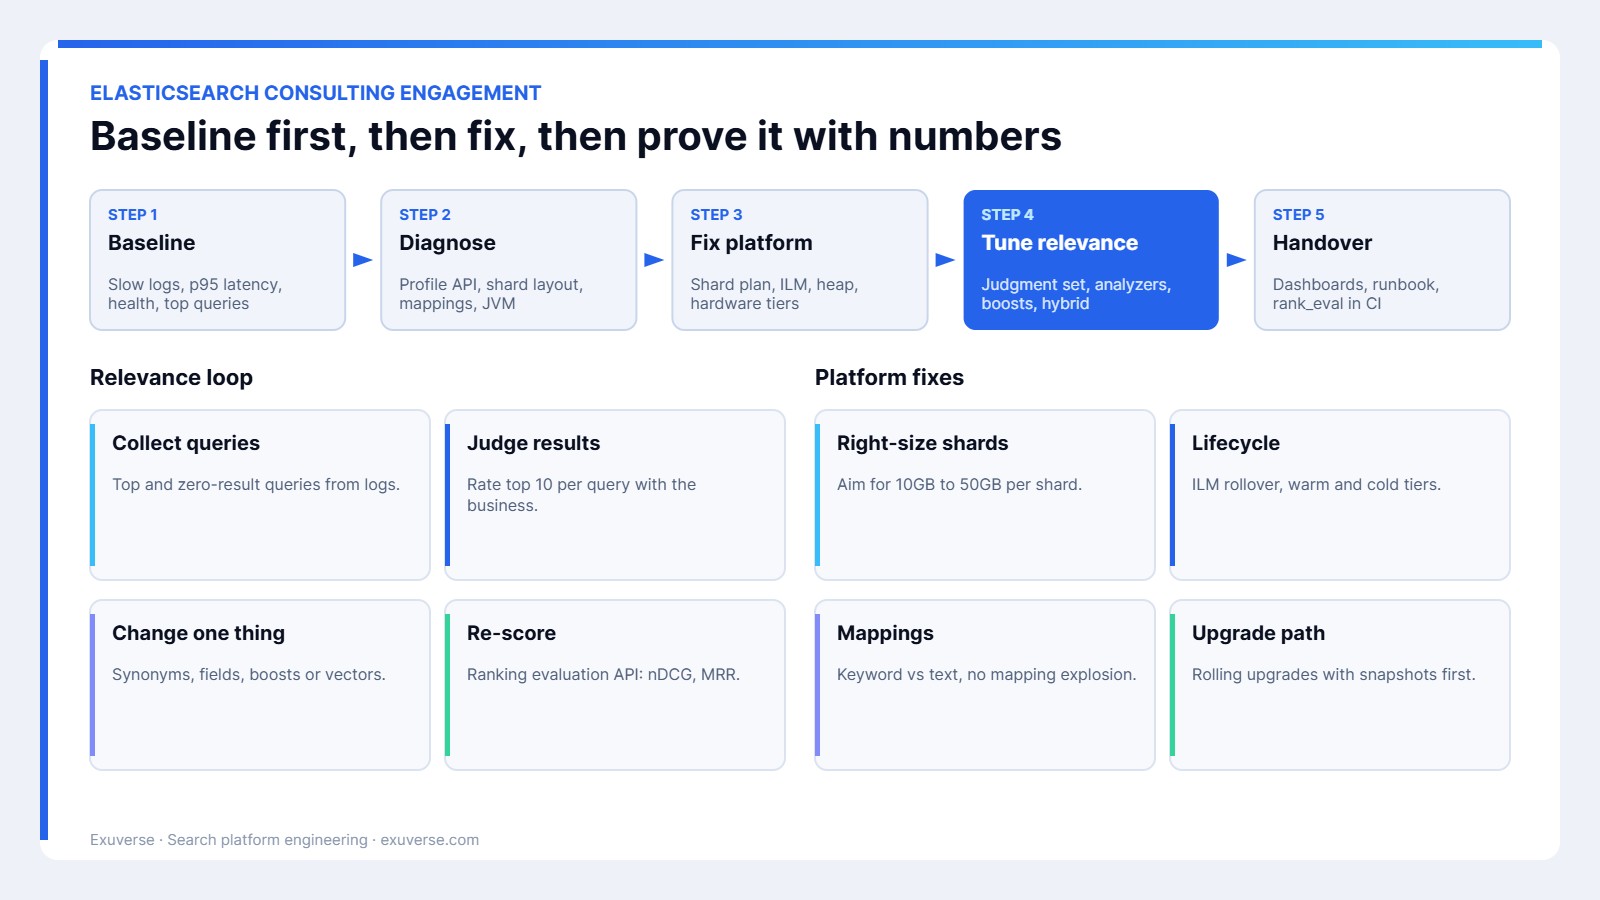
Relevance is where opinion usually wins, so the first job is to replace opinion with measurement. We build a judgment set: a few hundred real queries from logs, each with its top results graded by people who know the content. After that, every change is scored with Elastic’s ranking evaluation API, using metrics such as nDCG, MRR or precision at k.
With a baseline in place, the usual levers are analyzers and synonyms, field boosts, function scoring on business signals, and hybrid search that combines BM25 with vectors. If you want more depth, see our guides on hybrid keyword and vector search and learning to rank.
A practical example
Take an illustrative e-commerce catalogue: 12 million products, 40 daily indices created by a nightly job, one replica each, and a p95 search time of 1.8 seconds at sale time. Users also complain that searching a model number returns accessories first.
- Baseline: slow logs show most expensive requests hit all 40 indices, and the Profile API shows a wildcard query on SKU codes.
- Platform fix: daily indices are replaced by one alias with ILM rollover by size, cutting the shard count sharply.
- Query fix: SKU becomes a keyword field with a normaliser, so exact codes match without wildcards.
- Relevance fix: an exact-SKU match gets a strong boost, and a judgment set of 300 queries confirms the change before release.
As a result, the team can see latency, health and relevance move on a dashboard instead of arguing about them. The exact gains always depend on the data, which is why we measure rather than promise.
Elasticsearch consulting vs in-house vs vendor support
There is more than one way to get this work done, and a consultant is not always the right answer.
| Criteria | Elasticsearch consulting (Exuverse) | In-house team only | Vendor support subscription |
|---|---|---|---|
| Best for | Defined fixes and relevance programmes | Ongoing day-to-day operations | Break-fix help on supported versions |
| Relevance tuning | Core part of the work | Depends on skills | Usually out of scope |
| Speed to start | Days | Immediate but slow to learn | Ticket-based |
| Knowledge transfer | Runbooks, dashboards, training | Stays in-house | Limited |
| Cost pattern | Fixed project or retainer | Salaries | Annual subscription |
In short, many teams combine them: in-house engineers run the cluster, vendor support covers bugs, and a consulting partner handles the design and relevance work that needs deep search experience. If you also run Solr, our page on Apache Solr consulting services covers that side.
Pros and cons of Exuverse Elasticsearch consulting
Pros
- Search is a core practice for us, across Elasticsearch, Solr and Azure AI Search, so recommendations are not tied to one engine.
- Relevance work is measured with judgment sets and ranking evaluation, not screenshots.
- We can take search into AI features, such as retrieval-augmented generation for Intellowork.
- Handover includes runbooks and dashboards, so your team owns the result.
Cons
- We are an engineering partner, not Elastic, so licence and product support still come from the vendor.
- A good relevance programme needs time from your subject experts to grade results.
- Big platform changes, such as re-sharding, need maintenance windows and careful planning.
How we measure Elasticsearch consulting success
We do not publish made-up improvement figures. Instead, every engagement tracks the same framework from day one, using your own cluster and query logs:
| Measure | How it is tracked |
|---|---|
| Query latency | p50, p95 and p99 search time at peak |
| Cluster health | Days green, unassigned shard events, node restarts |
| Relevance | nDCG or MRR on the judgment set |
| Zero-result rate | Share of searches returning nothing |
| Cost efficiency | Nodes, storage tier mix and heap headroom |
| Recoverability | Last successful snapshot restore test |
Then the same dashboard stays with your team after handover, so regressions show up quickly.
Frequently asked questions
What does an Elasticsearch consulting company do?
It diagnoses and fixes slow queries, unstable clusters and poor relevance. Typical work covers shard and mapping design, JVM and hardware sizing, index lifecycle policies, upgrades, relevance tuning with judgment sets, and handover documentation.
Why is my Elasticsearch cluster yellow?
Yellow means every primary shard is assigned but at least one replica is not. Common causes are a single-node cluster with replicas set to one, a lost node, or disk watermarks blocking allocation. The cluster allocation explain API shows the exact reason.
How do I find slow Elasticsearch queries?
Turn on search slow logs with sensible thresholds, then run the worst queries through the Profile API. It shows which query clauses and aggregations take the time on each shard.
What is the right shard size in Elasticsearch?
Elastic recommends aiming for shards between 10GB and 50GB and keeping each shard below 200 million documents. Many small shards usually cost more than a few large ones.
How do you measure search relevance in Elasticsearch?
Build a judgment set of real queries with graded results, then score changes with the ranking evaluation API using metrics such as nDCG, MRR or precision at k.
Should we move from Elasticsearch to OpenSearch?
Only if licensing, cost or cloud alignment gives a clear reason. The APIs have diverged since the 2021 fork, so a migration needs testing like any other platform change.
Talk to an Elasticsearch consulting team
If your search is slowing down, your cluster will not stay green, or nobody can say whether results are improving, start with a baseline. We will review your slow logs, shard layout, mappings and a sample of real queries, then give you a prioritised fix plan. Contact Exuverse to book a review, or read more about our search relevance engineering work.